
Demand Forecasting for D2C Brands: A Practical Guide
How D2C brands can build demand forecasts that planners trust: the data, the models, the promotion problem and the operating rhythm that turns forecasts into inventory decisions.

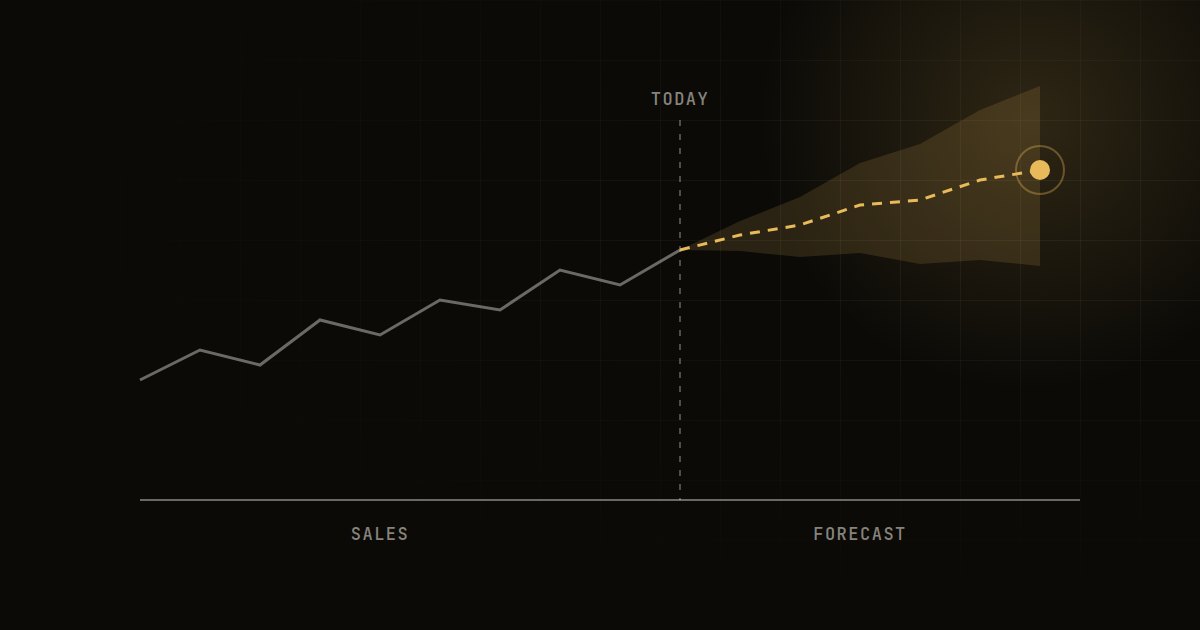
Demand forecasting for D2C brands means predicting unit sales by SKU, channel and location over the next few weeks to months, so you can plan purchase orders, production and warehouse stock. A good forecast combines clean order history, promotion and marketing calendars, and a simple, explainable model that planners review every week.
Most D2C brands start with a spreadsheet and a gut feel for the next sale event. That works until the catalogue passes a few hundred SKUs and you add marketplaces and quick commerce. This guide covers what works beyond the spreadsheet.
Why demand forecasting for D2C is harder than it looks
D2C demand has a few properties that make textbook forecasting methods struggle.
- Short histories. Many SKUs are less than a year old, so there is no full seasonal cycle to learn from.
- Promotion-driven spikes. Sale events, influencer campaigns and performance marketing bursts create spikes that dwarf baseline demand.
- Channel fragmentation. Your own website, two or three marketplaces, quick commerce dark stores and offline retail all behave differently and report data on different schedules.
- Censored demand. When a product is out of stock, sales drop to zero, but demand did not. Training on those zeros teaches the model to under-forecast.
- Long, lumpy lead times. Manufacturing runs and imports often need commitments 8 to 16 weeks ahead, while marketing plans change every fortnight.
So the model is only half the problem. The other half is data hygiene and a planning process that feeds human knowledge back in.
The data you need before you model anything
Before choosing an algorithm, get these data sets into one place, ideally a warehouse or lakehouse rather than a folder of exports.
| Data set | Why it matters | Common pitfall |
|---|---|---|
| Order lines by SKU, day, channel, pin code | The core demand signal | Returns and cancellations not netted off |
| Daily inventory position by location | Detects stockouts and censored demand | Only month-end snapshots available |
| Price and discount history | Explains elasticity and promo lift | Discounts stored only at order level |
| Promotion and campaign calendar | Separates baseline from uplift | Kept in someone's inbox, not a table |
| Marketing spend by channel and day | Leading indicator for demand | Attribution windows inconsistent |
| Product master (category, size, colour, launch date) | Lets new SKUs borrow from similar ones | Variants not linked to parent products |
| External calendar (festivals, paydays, weather) | Captures seasonality in India and abroad | Regional festivals ignored |
If you only fix one thing, fix stockout flagging. A simple rule, such as marking any day with zero available inventory as censored and excluding or imputing it, often improves forecast quality more than switching models.
If your data platform is still immature, our comparison of data lakehouse vs data warehouse explains which foundation suits a growing brand.
Choosing a forecasting approach
There is no single best model. The right choice depends on catalogue size, history length and how much promotion noise you have.
| Approach | Best for | Strengths | Limitations |
|---|---|---|---|
| Moving averages and seasonal naive | Baseline, sanity checks | Transparent, zero setup | Ignores promotions and trends |
| Exponential smoothing (ETS), ARIMA | Stable SKUs with 1 to 2 years of history | Well understood, fast | One model per series, weak with short history |
| Gradient boosted trees (LightGBM, XGBoost) on engineered features | Large catalogues with promotions | Handles price, promo and calendar features across all SKUs at once | Needs careful feature engineering and validation |
| Deep learning (global neural models) | Very large catalogues with rich data | Learns cross-SKU patterns | Harder to explain, heavier to run |
| Hierarchical reconciliation | Any of the above across category, channel, SKU | Forecasts add up consistently | Adds complexity to the pipeline |
In our experience, a global gradient boosted model trained on all SKUs together, with lag features, rolling averages, price, promotion flags and calendar features, is the most reliable workhorse for D2C. It lets a new lipstick shade borrow patterns from its siblings, and it treats discounts as inputs rather than noise.
Keep a seasonal naive benchmark alongside it. If your model cannot beat "same week last year, adjusted for trend" on the SKUs that matter, something is wrong.
Handling new product launches
New SKUs have no history, which is exactly when the buying decision is riskiest. Practical options include:
- Analogue mapping. Pick two or three comparable past launches by category, price band and launch channel, and scale their first 12 weeks.
- Attribute-based models. Use the product master (category, price, colour, size range) as features so the global model can predict from attributes alone.
- Test and reorder. Commit to a smaller first buy, read the first two to three weeks of sell-through, then reforecast. This is often the cheapest risk reducer of all.
Handling promotions and sale events
Model promotions explicitly. Add features for discount depth, promotion type, days to and from the event, and marketing spend. Forecast baseline and uplift separately so planners can see both. After each event, compare forecast uplift with actual and record the reason for large misses in a simple log. That log becomes your most valuable forecasting asset within a year.
Measuring forecast accuracy properly
Pick metrics that reflect business cost, not academic neatness.
- Weighted MAPE or WAPE, weighted by revenue or volume, so a miss on a hero SKU counts more than a miss on a long-tail variant.
- Bias, the average signed error. A model that is consistently 15 per cent high will quietly fill your warehouse.
- Accuracy at the decision horizon. If you place orders 10 weeks ahead, measure accuracy 10 weeks out, not next week.
- Service level and inventory outcomes. Ultimately track stockout days and weeks of cover on the SKUs that drive revenue.
Always backtest across several historical cut-off dates, including at least one major sale period, before trusting a new model.
A step-by-step rollout plan
Here is the sequence we recommend for a mid-size D2C brand building its first proper forecasting capability.
- Segment the catalogue. Classify SKUs by revenue contribution and demand variability (an ABC/XYZ matrix). Focus modelling effort on the high-revenue, forecastable segment first.
- Build the data foundation. Consolidate orders, inventory, price and promotions into one modelled table at SKU, day and channel grain, with stockout flags.
- Establish benchmarks. Measure the current spreadsheet forecast and a seasonal naive model on the same backtest.
- Train a global model. Start with gradient boosted trees, a modest feature set and weekly retraining.
- Reconcile the hierarchy. Make SKU forecasts add up to category and channel totals that finance recognises.
- Add human overrides with accountability. Let planners adjust forecasts for known events, but log every override and measure whether it improved accuracy.
- Connect to replenishment. Translate forecasts into reorder quantities using lead times, minimum order quantities and target service levels by segment.
- Operationalise. Automate data refresh, retraining, monitoring and alerts so the forecast arrives every Monday without anyone running a notebook.
Step 8 is where many projects stall. Our MLOps guide covers how to move a model from notebook to a reliable weekly pipeline.
Turning forecasts into decisions
A forecast has no value until it changes a purchase order. Build a weekly demand review in which planning, marketing and finance look at the same numbers: the forecast, the planned promotions, current cover and open purchase orders. Marketing should log its campaign calendar in the system, not surprise the supply team.
Set safety stock by segment rather than one rule for all. High-margin hero products with volatile demand justify higher safety stock, while slow long-tail variants may be better served by lower stock and longer customer delivery promises.
A typical scenario: a personal care brand runs a quarterly sale and historically orders the same uplift across all SKUs. Once baseline and uplift are forecast separately, planners can see that only a fraction of the catalogue responds strongly to discounts, and buy accordingly. The benefit comes from the conversation the forecast enables as much as from the model itself.
What it typically costs
Costs vary widely by scope, data quality and catalogue size. The main drivers are the state of your data (clean, centralised data significantly reduces the effort), the number of channels and locations, integration with ERP or inventory systems, and whether you need a planner-facing interface. As a rough guide only, a focused first version for a few hundred SKUs is usually a matter of weeks of senior effort, while a full multi-channel, multi-warehouse programme with replenishment integration runs to several months. Ongoing cloud compute for weekly retraining is usually modest compared with the people cost.
Frequently asked questions
What is the best model for demand forecasting in e-commerce?
There is no universal best model. For most D2C catalogues, a global gradient boosted model using price, promotion and calendar features performs well and stays explainable. Always compare it against a simple seasonal benchmark before adopting it.
How much historical data do I need for demand forecasting?
Ideally at least one full year so the model sees every season and major sale event, and two years is better. With less history, lean on global models that share patterns across similar SKUs and on analogue mapping for new launches.
How do I forecast demand for a new product with no sales history?
Use comparable past launches as analogues, or a model that predicts from product attributes such as category and price band. Pair this with a smaller initial buy and a fast reforecast once two to three weeks of real sales arrive.
How accurate should a D2C demand forecast be?
It depends on the SKU segment and horizon, so avoid a single target. Stable hero SKUs at a monthly, category level can be forecast far more accurately than long-tail variants at a daily, pin code level. Track weighted error and bias by segment, and judge success by stockouts and inventory cover.
How Sunday Labs can help
Sunday Labs helps D2C and retail brands build forecasting that planners actually use, from the data foundation through models to the weekly planning rhythm. Every engagement is led personally by our founder and delivered by senior engineers who have built production data systems at scale, so you work with the people doing the work. If stockouts or excess inventory are hurting margins, start a conversation and we will help you scope a sensible first step.